
LLM Evals at Scale: Lessons from the Real World
A Head of Engineering's guide to building production-ready LLM evaluation systems.

When ChatGPT 3.5 came out in November 2022, we managed to get early access to the API through the YC ecosystem. It was buggy, expensive, rate-limited, and the documentation was just a Notion page quickly put together by the OpenAI team. But none of that really mattered.
What mattered was that something fundamentally new had appeared.
This wasn’t just another API. It was a new kind of tool, one that could generalize across tasks we’d previously considered strictly human.
And as we started to build more and more on top of LLMs, it became crystal clear that this represents a major shift in software.
To build robust, reliable systems that our business could depend on, we needed a way to truly understand and measure its performance. That's when the real work of figuring out LLM evaluations began.
In this article, I'll walk you through the key lessons we learned while building an evaluation system for our internal, AI-powered customer support tool.
Why bother with evals?
Our first major LLM project: an AI-powered assistant for our customer support team. The goal was simple yet ambitious: once a customer message came in, the tool would generate a draft reply in our CRM. We aimed for a quality level so high that the drafts would be nearly identical to what our own care team would write.
The business value was clear. We could dramatically shorten reply times, improving the customer experience while maintaining the high quality our customers expected. After all, these were just drafts; our team would still review each one before it went out, providing a crucial human safety net.
Our first version was quite primitive. We started with some clever prompt engineering techniques and even implemented an early RAG system to pull information from our knowledge base. On the surface, it felt pretty good: it was generating drafts, and the initial excitement was high.
But how did we measure "improvement"? Our method was about as scientific as it sounds: we relied on a "vibe-check." Whenever we tweaked a prompt, we'd run a handful of test cases. If the new version seemed to answer those specific questions a bit better, that was our green light to push it to production.
This worked... until it didn't. Soon after an "improved" prompt went live, we'd start getting Slack messages from our care team—the very people we were trying to help. "Hey, the new drafts for billing questions are great, but the AI has completely forgotten how to handle refund requests."
The drafts were not useful. Instead of slightly editing a helpful draft, our team now had to delete useless ones and start from scratch, completely defeating the tool's purpose. We were playing a frustrating game of whack-a-mole. The core issue became painfully obvious: our "vibe-check" was not going to cut it.
We had no safety net to test if our "improvements" were causing these regressions, and we were eroding the trust of our internal team. We realized we weren't really engineering a reliable tool; we were just guessing.
LLM observability
Before we could evaluate LLM performance, we had to first see what was actually happening.
In traditional software systems, observability is a given. Logging inputs, outputs, exceptions, latencies and more. But with LLMs, this layer was largely missing when we began. Outputs were non-deterministic. Prompt changes were subtle but could have dramatic effects. Without visibility, we were essentially flying blind.
For each LLM request, we started logging:
Prompt input (including system/user messages and context snippets)
Dynamic context (including basic information, preferences, order history and more)
LLM metadata (model name, temperature, top_p, max tokens, provider)
Full response content
Request timestamp and latency
We integrated Langfuse as our main observability platform. It offered built-in tracing tailored to LLM pipelines.
Each generation is recorded as a “trace,” which can contain:
Spans (RAG context fetch, prompt construction, post-processing)
Events (API call to OpenAI, tool invocation, fallback triggers)
Metadata (ticket category, user cohort, response length)
This trace-based view allowed us to pinpoint where a draft failed. For example, did the issue stem from poor prompt engineering? Inaccurate context retrieved from RAG? Or was the model just hallucinating?
We could now debug each case holistically, not just the output but the entire generation flow.
Choosing the right metrics
Once observability was in place, we shifted focus to measurement.
But before we started pulling metrics, we asked ourselves: What does success actually look like for this tool?
If we could build a perfect version of our AI assistant, how would it behave?
For us, the answer was obvious: the human support team would not need to search for information or rewrite the message. They’d just review the draft and hit Send—at least 9 times out of 10.
From that goal, we started defining the metrics that would help us measure progress and spot regressions.
1. Levenshtein distance (Edit Effort)
Levenshtein distance is our shorthand for “How much cleanup did a human need to do before the reply could ship?” The fewer characters (or tokens) they had to insert, delete, or swap, the closer the draft was to being ready-to-send and the more time we saved!
To make this easier to interpret, we normalized the score to a 1 - 10 scale.
This gave us a clean, quantitative way to measure draft usefulness at scale.
(Pro tip: plenty of off-the-shelf packages exist depending on your tech stack.)
2. LLM-as-a-judge: Content accuracy
Once we had edit distance in place, we realized it wasn’t enough.
Two messages can be vastly different in wording but still convey the same information. On the flip side, two messages might be nearly identical in form but differ in one small, critical fact. We needed a metric that could evaluate meaning, not just character changes.
So we turned to LLMs themselves.
We built an internal evaluator system that uses a language model to compare the AI-generated draft with the final human-edited version. It scores how accurately the AI preserved the essential information.
Here’s a simplified version of the scoring rubric we feed into the LLM:
## Evaluation Guidelines

### Content Accuracy Similarity (0-1)
Evaluate how well the AI draft conveys the same essential information as the human response:

- Score 1.0: Contains all the same critical information
- Score 0.7-0.9: Minor information differences that don't significantly impact the message
- Score 0.4-0.6: Missing or different important details
- Score 0.1-0.3: Major information gaps or differences
- Score 0.0: Completely different or contradictory information
This scoring method gives us a scalable, semi-automated way to evaluate semantic fidelity. It’s not perfect, but across thousands of generations, the signal is strong.
And importantly, it catches things that edit distance would miss, like an accurate rephrasing, or a polite but factually incorrect response.
3. LLM-as-a-judge: Tone similarity
Accuracy is important, but in support, tone is everything.
A message can be factually perfect and still get flagged by our care team if it feels too cold, too robotic, too aggressive, or just… off.
So we added a second dimension to our LLM judge: tone similarity.
Instead of running a separate model call (which would’ve increased our evaluation costs), we expanded the existing prompt to include a section on tone, keeping things efficient and bundled.
Here’s how we defined it:
## Evaluation Guidelines

### Content Accuracy Similarity (0-1)
...


### Tone Similarity (0-1)
IMPORTANT: Evaluate tone COMPLETELY INDEPENDENTLY from content accuracy. Two messages can have completely contradictory information yet still have similar tones and vice versa.

Tone refers ONLY to the style of communication, including:
- Level of warmth and friendliness
- Degree of formality vs. conversational language
- Use of personal vs. clinical/technical language
- Presence of enthusiasm, empathy, or emotional content
- Sentence structure complexity and word choice

Score tone similarity as follows:
- Score 1.0: Virtually identical tone and style
- Score 0.8-0.9: Very similar tone with minor stylistic differences
- Score 0.5-0.7: Noticeable differences in warmth, formality, or engagement
- Score 0.2-0.4: Significantly different tone
- Score 0.0: Completely different tone (e.g., extremely casual vs. highly formal)
This was especially helpful for categories like onboarding, sensitive medical topics, or cancellations—where emotional tone makes or breaks the message.
By measuring tone and content separately, we could pinpoint exactly where things were going wrong. That level of granularity was critical for improving prompts with confidence.
4. Human rating
Finally, we wanted direct feedback from the people using these drafts every day—our care team.
We built a small in-CRM rating plugin that attaches to every draft message. It lets care agents rate a draft from 1 to 10 stars in a couple of clicks. If the score is less than 4, they’re prompted to leave a quick note explaining what went wrong.
This feedback is gold. It gives us:
Subjective signal from real-world usage
Examples of tone mismatches or edge cases that automated metrics missed
Early warning when something is subtly but consistently off
But we don’t treat it as our primary metric. And here’s why:
It’s sparse. Most drafts don’t get rated. Teams are busy.
It’s biased. People mostly rate the extremes, only the very good or very bad.
It’s inconsistent. Tone preferences can vary by agent or mood.
That said, when a human leaves a comment like “This feels too cold” or “It missed the patient’s concern entirely,” we pay attention.
In practice, we treat human ratings as a qualitative layer on top of our automated metrics. They’re essential for triaging, root-cause analysis, and uncovering blind spots, but they aren’t something we can rely on at scale without support from structured evaluations.
Building the pipeline: storage, query, display
Now that we’ve defined the key metrics to collect, let’s walk through how we actually store and analyze them.
Events from the CRM
Our evaluation system relies on three primary events emitted by the CRM:
onInboundMessageEventReceived: triggered when a customer sends a message
onOutboundMessageEventReceived: triggered when our care team sends a reply
onDraftRatingEventReceived: a custom event triggered when a human rates a draft
Here’s how the flow works in practice.
When a customer message comes in, we receive the onInboundMessageEventReceived event. At this point, our system generates a draft reply using the LLM and returns it to the CRM, where it can be reviewed, edited, and either sent or discarded by the care team. The generated draft is also stored in our database.
CREATE TABLE Chats (
  id UUID PRIMARY KEY,
  conversationId UUID NOT NULL,
  userId UUID NOT NULL,
  draftContent TEXT,
  sentContent TEXT,
  isDraft BOOLEAN,
  createdAt TIMESTAMP DEFAULT NOW()
);
Later, when the care team sends a message, we receive the onOutboundMessageEventReceived event. Using metadata from the event, we map the outbound message back to the correct draft stored earlier.
We then update that row in the Chats table:
isDraft is set to false
sentContent is populated with the human-edited message
At this point, we have both the original AI-generated draft and the final message that was sent to the customer. This is when evaluations are triggered.
Storing evaluation scores
Each evaluated draft is associated with a single row in the ChatsEvalScores table:
CREATE TABLE ChatsEvalScores (
  id UUID PRIMARY KEY,
  draftId UUID NOT NULL REFERENCES Chats(id),
  editDistanceScore FLOAT,
  accuracyScore FLOAT,
  toneScore FLOAT,
  careTeamScore INT,
  createdAt TIMESTAMP DEFAULT NOW()
);
The careTeamScore is only present if a human rated the draft. This rating is captured via the onDraftRatingEventReceived handler, which is triggered after the agent uses our custom CRM plugin to submit feedback.
Syncing to the data warehouse
All database records are synced daily to our AWS Redshift warehouse. This includes both the Chats and ChatsEvalScores tables.
We use Metabase on top of Redshift to build dashboards and monitor trends across time, ticket categories, cohorts, model versions, and more.
Here’s what a typical dashboard might include:
AI Performance Index (Combined metric)
Edit Distance
Accuracy Score
Tone Similarity
Care Team Score
Trends
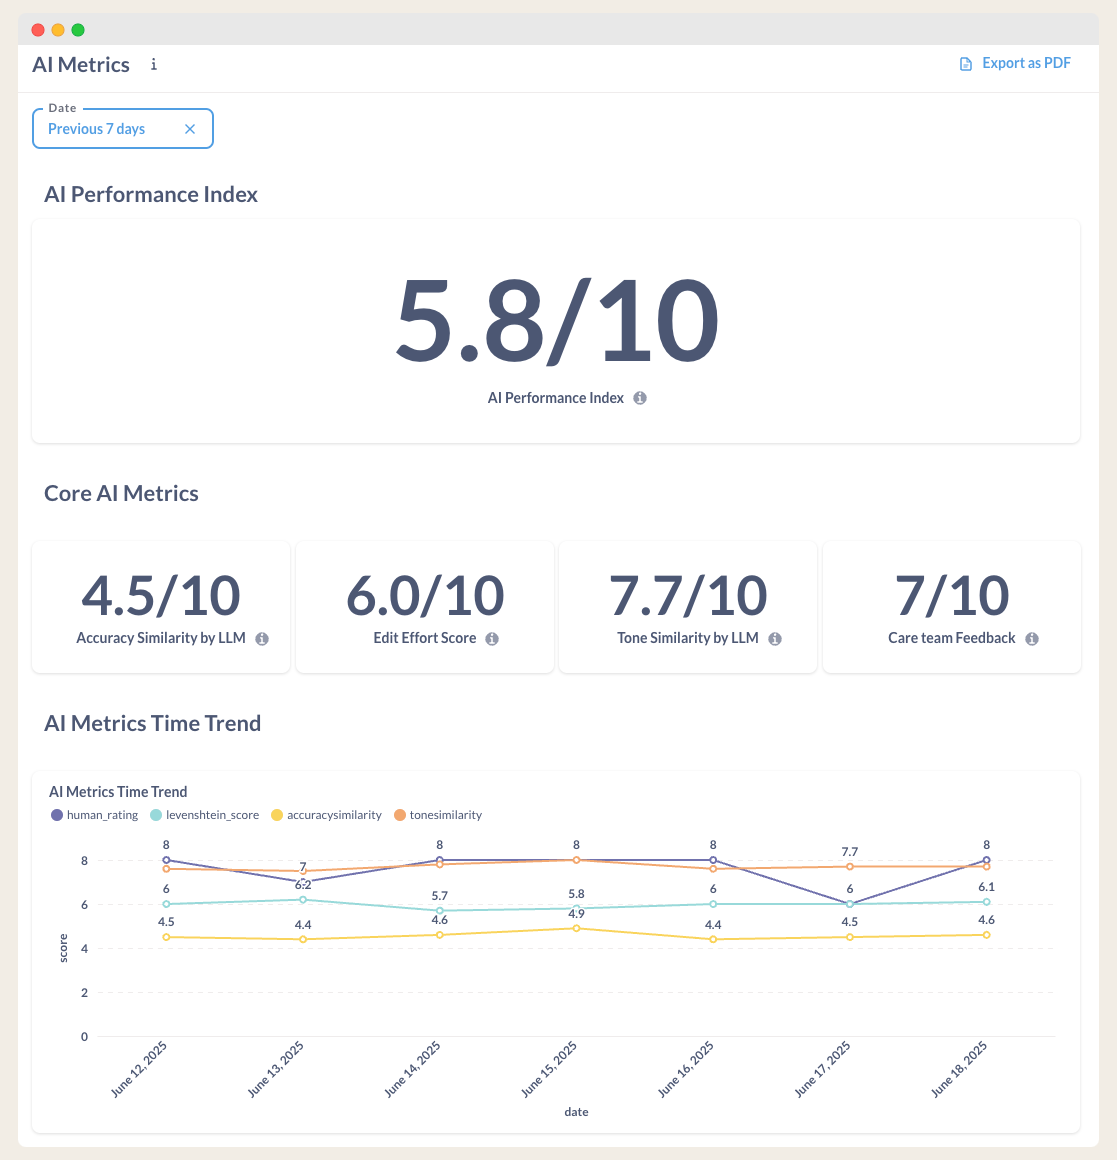
The AI Performance Index
To make it easier to track overall quality, we combine the four core metrics into a single value: the AI Performance Index.
This index is a weighted average where each score contributes based on its importance to our use case. Our current formula is:
Accuracy Score: 40%
Edit Distance: 30%
Tone Score: 20%
Support Team Score: 10%
Of course, other weights for each of these metrics might make more sense for you. Feel free to adjust the AI performance index to your needs.
Building the LLM test suite
Now that we’re collecting evaluation metrics reliably, the next step is to create a fast feedback loop.
To hit our quality goals, we need to iterate quickly and with confidence. That means understanding the impact of a prompt or model change without having to wait for real customer conversations to expose issues. We wanted a way to simulate production-like scenarios locally, benchmark improvements, and catch regressions immediately.
The answer was a test suite.
We started by curating 20 to 30 representative cases. These covered common support flows such as billing, shipping, onboarding, and cancellations. Each test case includes three parts:
Input context (customer profile and conversation history)
The incoming request
The ideal human-written response
Here’s how a typical structure looks:
// llm/tests/cases.json

[
  {
    "id": "case-1",
    "input": {
      "customerInfo": "{ /* All relevant user profile data */ }",
      "conversationHistory": "{ /* Recent back-and-forth messages */ }"
    },
    "request": "I haven't received my order yet, please help",
    "idealResponse": "Hey Mark, you should receive your order by tomorrow afternoon."
  },
  {
    "id": "case-2",
    ...
  }
]
With test cases in place, we added a simple runner script that generates a draft for each scenario and compares it to the ideal response using the same metrics we use in production.
// llm/tests/runner.ts

import cases from './cases.json';
import { generateDraftReply } from './generateDraftReply';
import { computeScores } from './metrics';

let sumEdit = 0, sumAcc = 0, sumTone = 0;
const start = Date.now();

for (const c of cases) {
  const draft = await generateDraftReply(c.input);
  const { edit, accuracy, tone } = await computeScores(draft, c.idealResponse);

  sumEdit += edit;
  sumAcc += accuracy;
  sumTone += tone;
}

const n = cases.length;
const sec = ((Date.now() - start) / 1000).toFixed(0);

console.log(`LLM Test Suite run successfully. Time elapsed ${sec} sec.`);
console.log(`Edit Distance Score (avg): ${ (sumEdit / n).toFixed(2) } /10`);
console.log(`LLM Accuracy Score (avg):  ${ (sumAcc / n).toFixed(2) } /10`);
console.log(`LLM Tone Score (avg):      ${ (sumTone / n).toFixed(2) } /10`);
We also added a script to package.json so the suite can be executed with a single command:
// package.json
"scripts": {
  "eval": "ts-node src/llm/tests/runner.ts"
}
Running the suite looks like this:
> npm run eval

LLM Test Suite run successfully. Time elapsed 41 sec.
Edit Distance Score (avg): 7.20 /10
LLM Accuracy Score (avg): 7.67 /10
LLM Tone Score (avg): 7.83 /10
This local test suite has become a key part of our development workflow. Anytime we make a prompt change, adjust RAG logic, or test a new model, we can benchmark performance across known scenarios instantly. It’s the fastest way to validate improvements and, more importantly, catch regressions before they impact production.
As the system evolves, the suite grows. We regularly add new test cases based on real conversations that didn’t go as expected, edge cases that triggered feedback, or just interesting outliers that are worth stress-testing. Over time, this creates a rich library of scenarios that function as a safety net for every change we make.
Closing the loop: using eval scores to tune prompts and context
Once the evaluation system is in place and metrics are flowing, the next question becomes: now what?
The value of an evaluation system doesn’t come from the scores alone. It comes from how those scores are used to drive improvement. We didn’t build all this to feel good about a dashboard. We built it to make the product better.
Here’s how we actually use it day to day.
Categorize every draft
Every draft message in our system is tagged with a category based on the ticket type. These include things like billing, refunds, onboarding, prescription refills, cancellations, and more. We pull this directly from the support metadata and store it alongside each evaluation.
This step is critical. Without categorization, all metrics are averaged together, which makes it nearly impossible to understand where things are breaking down. Once we added category tagging, the blind spots became obvious.
Sort by lowest-performing examples
Inside Metabase, we maintain views that surface the lowest-scoring drafts for each category. These are sorted by either the AI Performance Index or by individual metrics like accuracy or tone.
This gives us an actionable starting point. Instead of guessing where to focus, we can just work from the bottom of the list and address one broken case at a time.
Use observability to investigate failures
When a low-scoring draft stands out, we open it in Langfuse to examine the full trace.
We review:
The raw prompt input
The retrieved context snippets
LLM config like model version and temperature
The actual AI draft versus what the human ultimately sent
This is where the root cause usually reveals itself. Sometimes the context is irrelevant. Sometimes the prompt was too vague. Sometimes the model just misunderstood the intent.
Having full observability makes it easy to debug the entire generation flow, not just the final output.
Turn real failures into test cases
When we find a good example of something that broke in production, we export the relevant customer data and turn it into a new test case.
Our custom clinic operations platform does have an “Export as XML” or JSON button, which makes this simple. We paste that into a new test suite case and pair it with the ideal human-written response.
Now this failure is part of our automated test loop. If it breaks again in a future prompt update, we’ll catch it before it goes live.
Iterate locally, then ship
Once the failing example is added to the suite, we iterate. This usually involves prompt tuning, better formatting, or improving how we inject context.
After each change, we re-run the test suite. If the new version fixes the issue without hurting overall scores, we deploy it. Then we move on to the next one.
This process is fast, surgical, and tied directly to real user experience. It helps us improve without guessing, and gives the team confidence that each change is actually making things better.
Conclusion
LLMs are unpredictable by nature. Without a structured way to define and measure quality, it becomes difficult to tell if your system is improving or just changing.
The strength of a good evaluation system is that it gives you confidence. If your metrics are well-defined, they represent the real qualities you care about: clarity, accuracy, tone, and consistency. These scores turn vague expectations into something measurable, so you can track progress, catch problems, and improve with intent.
Once that foundation is in place, iteration becomes a repeatable process.
You identify a weak area based on the scores. Maybe tone is off in refund replies, or accuracy drops when product details are involved. You investigate the specific examples, adjust the prompt, and run your test suite. Within minutes, you know whether the change helped or introduced new issues.
This speed is what enables real progress.
If the updated prompt performs well, you deploy it. Once it’s live, you continue monitoring the same metrics, broken down by category and version. If something slips, you catch it. If it holds or improves, you keep moving.
That cycle: review, refine, test, deploy, and monitor is what makes LLM systems reliable. Not because the models are predictable, but because your process is.
About Me
I’m Gzim, and I've been writing software since 2009, professionally since 2015.
At 23 (2019), I launched a software development agency that grew to $1M in annual revenue. In 2022, I transitioned to a founding engineer role at AIOS Medical (YC W20/S21), where I helped scale the company from $30K to $70M in ARR.
Today, I lead a team of 14 as Head of Engineering at AIOS Medical, overseeing product, architecture, and engineering execution.
👏
Amazing breakdown! We often get to see the end product but how it all came to be is the most fascinating part.